Automated system testing with Cucumber, Playwright, Selenium and Kubernetes

A test suite is only useful if people trust it. That means three things: everyone can read what it checks, it gives the same answer every time, and it runs on every change without anyone remembering to start it.
This guide walks through a setup that does all three. Scenarios are written in plain language with Cucumber, browsers are driven by Playwright or Selenium, and a CI/CD pipeline runs the whole suite in parallel on Kubernetes.
Every screenshot here comes from a real run. I pointed the tests at this website, so the code you see is code that actually ran.
What you’ll learn
- What a system test is, and where it fits next to unit and integration tests
- How to write Cucumber scenarios that the whole team can read
- When to pick Playwright and when Selenium is the better choice
- How to build a pipeline where the tests decide what ships
- How to run hundreds of browser tests in parallel on Kubernetes
Part 1: What system testing is
One level per question
Every test level answers a different question. The V-model puts this in one picture: each design document on the left has a test level on the right that checks it.
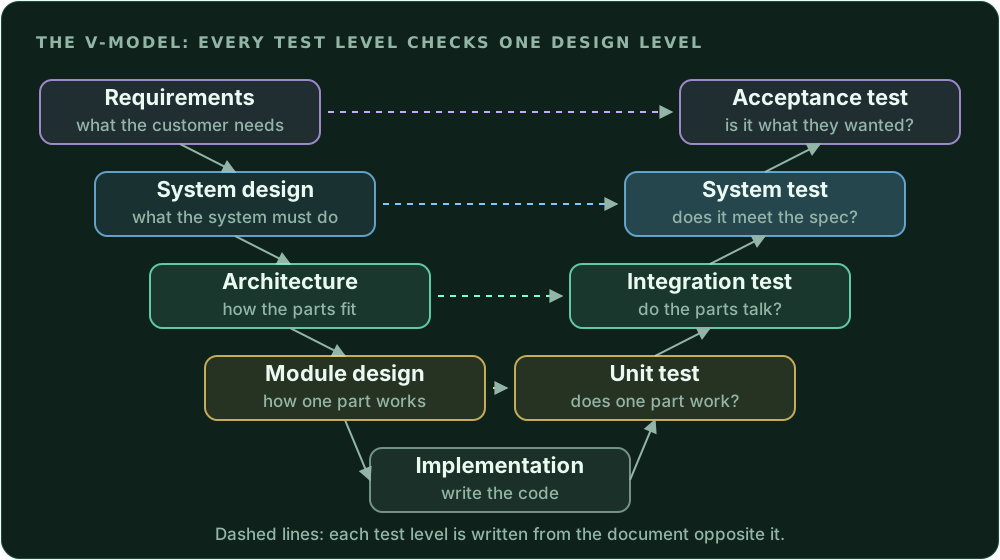
A system test looks at the finished product from the outside, the way a user or another system sees it. It runs against the specification, not the code. It runs in an environment that is as close to production as you can get: the real build, real configuration and real interfaces.
That’s also why system tests are the most expensive ones. They need a whole running system and they take longer. Automation is what makes them affordable to run every day instead of once before a release.
Two roles, one goal
The two job titles overlap a lot, but the focus is different:
System test
- Reads the requirements and finds what is missing or unclear
- Designs test cases: normal flows, edge cases, failure cases
- Owns the test environment, the test data and the bench
- Decides if a release is ready
Test automation
- Turns test cases into code that runs on its own
- Builds the framework: steps, drivers, reports
- Wires the tests into CI/CD and keeps them fast
- Hunts down flaky tests
In most teams one person does both. The best automated tests come from people who think like testers first and write code second.
Takeaway
Automate the test cases that run often and break expensively. A test you run once a year can stay manual.
Part 2: Cucumber, tests in plain language
Why plain language
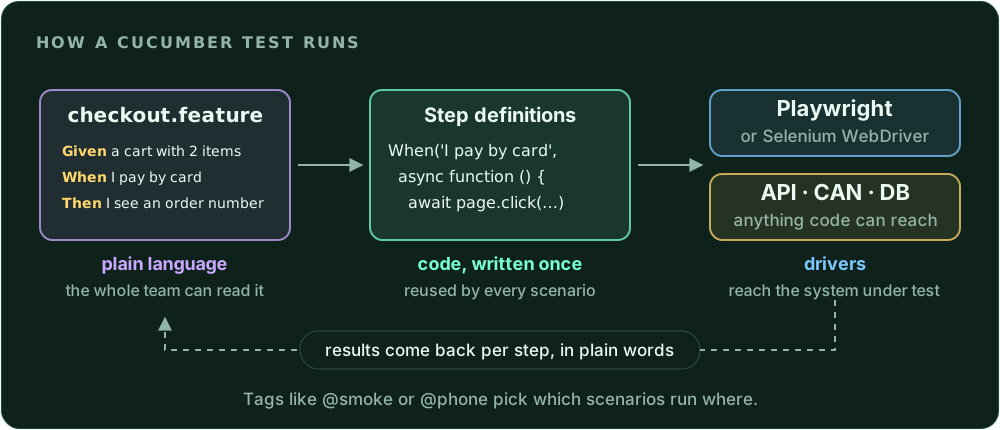
A test written in code is readable to developers. A test written in plain language is readable to everyone: the product owner, the tester, the developer and the new colleague in their first week. When everyone reads the same scenario, misunderstandings show up before anyone writes code, not after.
This way of working is called behaviour-driven development (BDD). Cucumber is the tool that turns those plain-language scenarios into automated tests. It exists for JavaScript, Java, Ruby and more, and for .NET there is Reqnroll (the successor of SpecFlow).
The Gherkin keywords
Scenarios are written in a small language called Gherkin. You only need a handful of keywords:
| Keyword | What it does |
|---|---|
Feature |
Names the feature and explains why it matters |
Scenario |
One concrete example of the behaviour |
Given |
The starting situation |
When |
The action |
Then |
The expected result |
And, But |
Continue the previous line |
Background |
Steps that run before every scenario in the file |
Scenario Outline + Examples |
The same scenario with a table of inputs |
@tag |
Labels to pick which scenarios run, like @smoke |
A real feature file
Here is a feature I ran against this site. It checks that every page in the main menu opens, and that the home page fits on a phone:
Feature: Main menu
  Visitors should reach every main page from the menu,
  on a laptop and on a phone.

  Background:
    Given I open the home page

  Scenario Outline: Open a page from the main menu
    When I choose "<link>" in the main menu
    Then I see the heading "<heading>"
    And the address ends with "<path>"

    Examples:
      | link           | heading                  | path             |
      | CV             | The journey so far       | /cv/             |
      | Certifications | Certificates             | /certifications/ |
      | Follow Me      | Follow Me                | /follow-me/      |
      | Hobbies        | What should we do today? | /hobbies/        |

  @phone
  Scenario: The home page fits a phone screen
    Then the page does not scroll sideways
Read it out loud. You don’t need to know any code to see what it checks.
Step definitions: where plain language meets code
Each line of a scenario matches a step definition. The {string} in the pattern catches the quoted value and passes it to the function. These steps use Playwright to drive the browser:
import { Given, When, Then } from '@cucumber/cucumber';
import { expect } from '@playwright/test';

Given('I open the home page', async function () {
  await this.page.goto(this.baseUrl + '/');
});

When('I choose {string} in the main menu', async function (name) {
  await this.page.locator('#site-nav').getByRole('link', { name, exact: true }).click();
});

Then('I see the heading {string}', async function (text) {
  await expect(this.page.getByRole('heading', { level: 1, name: text }).first()).toBeVisible();
});

Then('the address ends with {string}', async function (path) {
  await expect(this.page).toHaveURL(new RegExp(path + '$'));
});

Then('the page does not scroll sideways', async function () {
  const [scrollWidth, width] = await this.page.evaluate(
    () => [document.documentElement.scrollWidth, innerWidth]);
  expect(scrollWidth).toBeLessThanOrEqual(width);
});
Four steps cover five scenarios. That’s the real win of Cucumber: once you have a good set of steps, new scenarios are often just new sentences.
Hooks: a clean browser for every scenario
Hooks run before and after each scenario. Two habits make a big difference here. First, every scenario gets its own browser context, so no cookies or storage leak from one test into the next. Second, a failed scenario attaches a screenshot to the report:
import { setWorldConstructor, World, BeforeAll, AfterAll, Before, After } from '@cucumber/cucumber';
import { chromium, devices } from '@playwright/test';

let browser;

class SiteWorld extends World {
  baseUrl = process.env.BASE_URL ?? 'http://localhost:4000';
}
setWorldConstructor(SiteWorld);

BeforeAll(async () => { browser = await chromium.launch(); });
AfterAll(async () => { await browser.close(); });

// a fresh, isolated browser context for every scenario
Before(async function ({ pickle }) {
  const phone = pickle.tags.some(t => t.name === '@phone');
  this.context = await browser.newContext({
    ...(phone ? devices['iPhone 13'] : { viewport: { width: 1440, height: 900 } }),
    reducedMotion: 'reduce',
  });
  this.page = await this.context.newPage();
});

// on failure, attach a screenshot to the report
After(async function ({ result }) {
  if (result?.status === 'FAILED') {
    this.attach(await this.page.screenshot(), 'image/png');
  }
  await this.context.close();
});
The @phone tag switches the scenario to a phone viewport. The base URL comes from an environment variable, so the same tests run against a laptop, a test server or a fresh environment in the pipeline.
Running it and reading the report
The configuration is a few lines:
// cucumber.mjs
export default {
  paths: ['features/**/*.feature'],
  import: ['features/support/*.mjs', 'features/steps/*.mjs'],
  format: ['progress-bar', 'html:reports/cucumber.html'],
};
Then npx cucumber-js runs everything, and npx cucumber-js --tags @phone runs only the tagged scenarios. The HTML report shows every step in plain language, with its time and result:
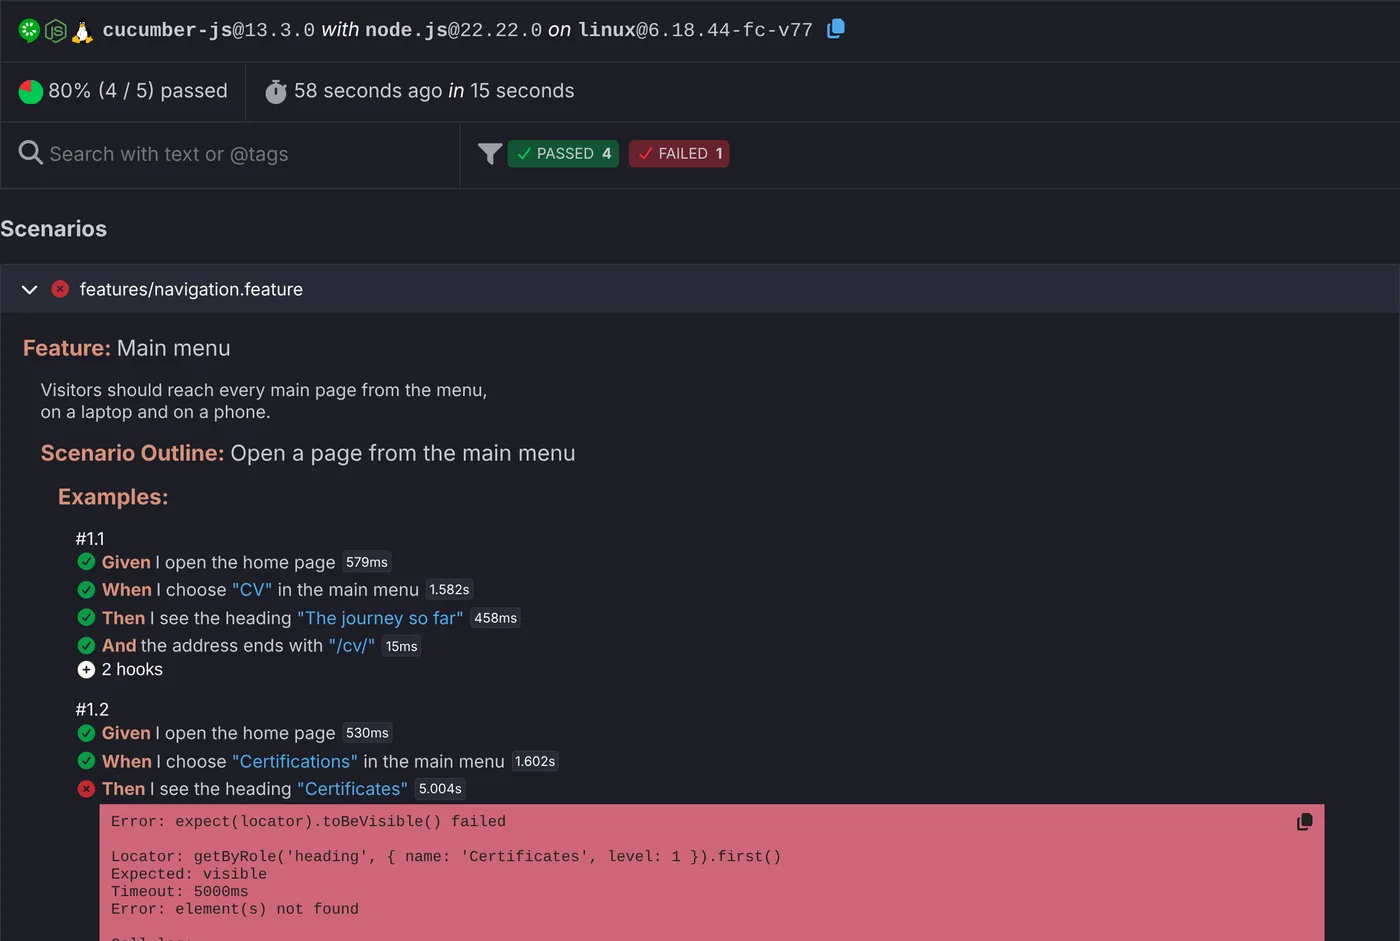
That failure is on purpose. It shows the best part of a good BDD report: a product owner can read which behaviour broke, and a developer gets the exact locator and error underneath.
Good Gherkin vs bad Gherkin
The most common mistake is writing scenarios like a click-by-click script. They get long, they break when the UI changes, and nobody outside the test team reads them.
Imperative: a click-by-click script. Tied to the page layout, so it breaks on every redesign.
Given I go to "/login"
And I type "anna" into "#user"
And I type "secret" into "#pass"
And I click "#submit"
Then I see ".alert-ok"
Declarative: the behaviour. The details live in the step code, written once.
Given Anna has an account
When she logs in
Then she sees her dashboard
A few more rules I stick to:
- One behaviour per scenario. If the title needs an “and”, split it.
- Three to seven steps. Longer scenarios hide what they test.
- Use the words of the business. “Invoice is approved”, not “status field is 3”.
- No test data in the steps that nobody cares about. Let the step code create it.
- Tags with a purpose:
@smokefor the fast set,@slow,@phone,@hilfor the hardware bench.
Takeaway
Write the scenario so the product owner can say “yes, that’s what I meant”. If they can’t, the scenario isn’t finished.
Part 3: Playwright
Why Playwright
Playwright is a browser automation framework from Microsoft. It drives Chromium, Firefox and WebKit, and comes with its own test runner. Three things make it pleasant for system tests:
- It waits for you. Before clicking, it checks that the element is visible, stable and enabled. Assertions like
toBeVisible()retry until they pass or time out. No moresleep(2). - Every test is isolated. Each test gets a fresh browser context, like a new private window, in milliseconds.
- Debugging is built in. Traces, screenshots and videos show what happened when a test failed on a machine you can’t log into.
Configuration
This is the configuration I used. One project runs as a laptop, one as a phone:
// playwright.config.mjs
import { defineConfig, devices } from '@playwright/test';

export default defineConfig({
  testDir: 'tests',
  fullyParallel: true,
  retries: process.env.CI ? 1 : 0,
  reporter: [['html', { open: 'never' }]],
  use: {
    baseURL: process.env.BASE_URL ?? 'http://localhost:4000',
    trace: 'on',
    screenshot: 'only-on-failure',
  },
  projects: [
    { name: 'laptop', use: { ...devices['Desktop Chrome'] } },
    { name: 'phone', use: { ...devices['Pixel 7'] } },
  ],
});
I keep trace: 'on' for this demo. On a real pipeline 'on-first-retry' or 'retain-on-failure' saves a lot of storage.
A test
import { test, expect } from '@playwright/test';

test.use({ reducedMotion: 'reduce' });

test('a post opens from the home page', async ({ page }) => {
  await page.goto('/');
  await page.getByRole('link', { name: /Soldering 101/ }).first().click();
  await expect(page).toHaveURL(/soldering-101/);
  await expect(page.getByRole('heading', { level: 1 })).toHaveText(/Soldering 101/);
});
Notice the locators: getByRole('link', { name: ... }) finds the element the way a user does, by what it is and what it says. CSS classes change with every redesign. What a button says rarely does.
The report and the trace viewer
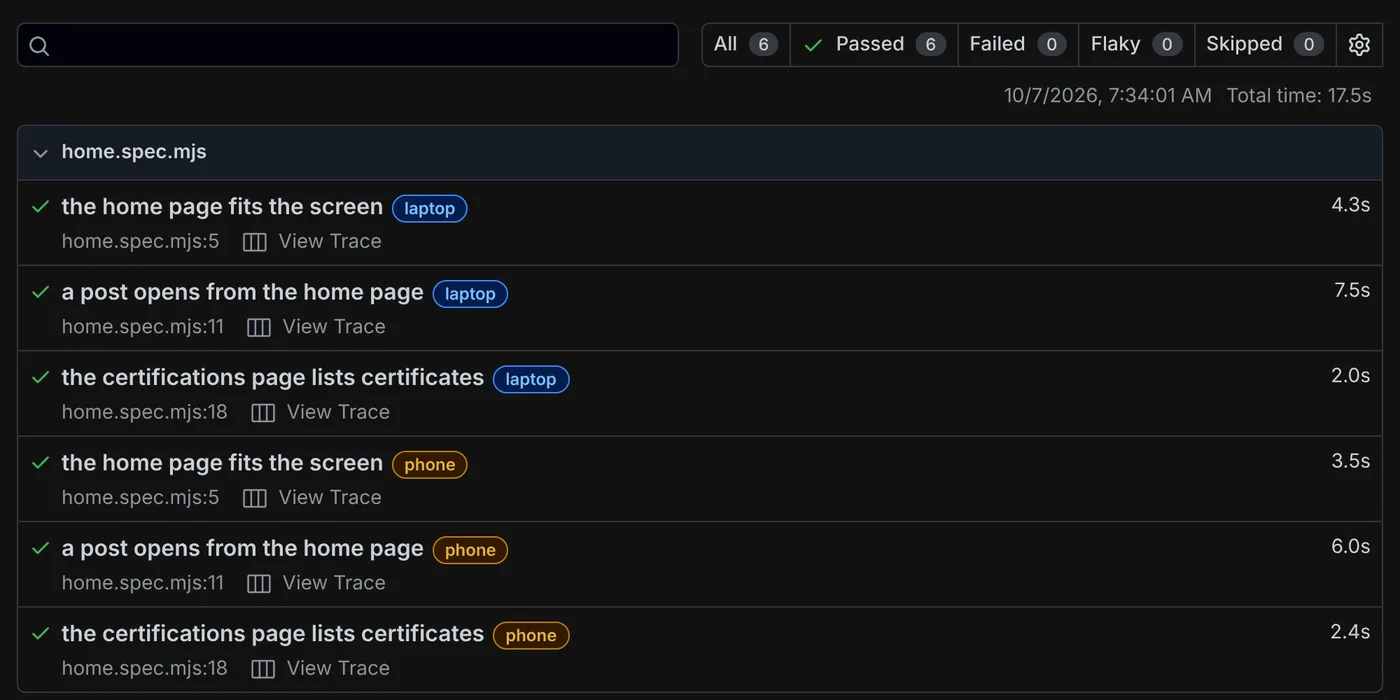
When a test fails on CI, the trace is the first thing I open. It records every action with a snapshot of the page before and after, the network requests and the console:
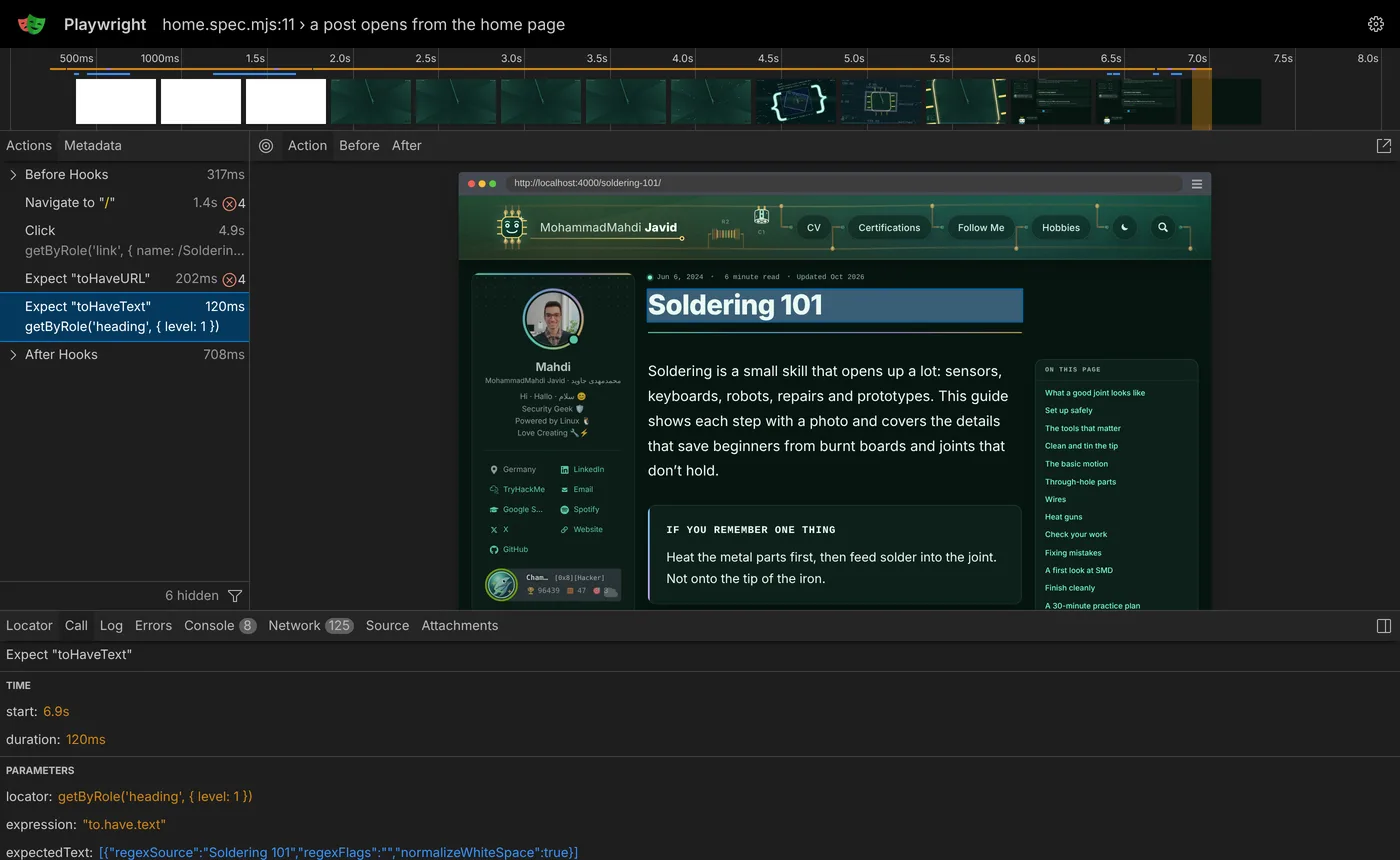
The trace also told me something about my own site: the first click waited almost five seconds, because the opening animation on the home page covers the links until it finishes. That’s the kind of thing you only notice when a tool measures it for you.
Habits that keep Playwright tests stable
- Locate by role, label and text, not by CSS or XPath.
- Use web-first assertions (
await expect(locator).toBeVisible()), neverexpect(await locator.isVisible()), which checks once and doesn’t wait. - Prepare data through the API, then use the browser only for what you want to check. Clicking through five screens to create a customer makes every test slow.
- Log in once and reuse the session. Save the storage state after one login and load it in every test.
- Test the phone layout as its own project, not as an afterthought.
Part 4: Selenium
Still the standard
Selenium has been around since 2004, and WebDriver is a W3C standard that every major browser vendor implements. Many companies have years of Selenium tests in Java or C#, and they still work well.
Selenium is often the better choice when:
- Your team writes Java or C# and already has a test framework around it.
- You need the real branded browsers, including Safari on macOS.
- You run Selenium Grid to spread tests across many machines and browsers.
- You also test native mobile apps: Appium uses the same WebDriver protocol.
Cucumber with Selenium in Java
The same Gherkin scenarios work with Cucumber for Java. The difference is mostly in the waits: Selenium doesn’t wait on its own, so you wait explicitly for the state you need.
public class LoginSteps {
    private final WebDriver driver;
    private final WebDriverWait wait;

    // DriverFactory is injected by cucumber-picocontainer, one per scenario
    public LoginSteps(DriverFactory factory) {
        this.driver = factory.driver();
        this.wait = new WebDriverWait(driver, Duration.ofSeconds(10));
    }

    @Given("{word} has an account")
    public void hasAccount(String user) {
        TestUsers.create(user);               // through the API, not the UI
    }

    @When("{word} logs in")
    public void logsIn(String user) {
        driver.get(Config.baseUrl() + "/login");
        driver.findElement(By.id("username")).sendKeys(user);
        driver.findElement(By.id("password")).sendKeys(TestUsers.password(user));
        driver.findElement(By.cssSelector("button[type=submit]")).click();
    }

    @Then("{word} sees her/his dashboard")
    public void seesDashboard(String user) {
        WebElement title = wait.until(
            ExpectedConditions.visibilityOfElementLocated(By.tagName("h1")));
        assertEquals("Dashboard", title.getText());
    }
}
Running against a Selenium Grid instead of a local browser is a one-line change:
public class DriverFactory {
    private WebDriver driver;

    public WebDriver driver() {
        if (driver == null) {
            String grid = System.getenv("SELENIUM_GRID_URL");   // e.g. http://selenium-hub:4444
            driver = grid == null
                ? new ChromeDriver()
                : RemoteWebDriver.builder().address(grid).oneOf(new ChromeOptions()).build();
        }
        return driver;
    }

    @After
    public void quit() {
        if (driver != null) driver.quit();
    }
}
This is a sketch: Config and TestUsers stand for your own helpers. The her/his in the step pattern is Cucumber’s way of accepting either word.
Playwright or Selenium?
| Playwright | Selenium | |
|---|---|---|
| Languages | TypeScript, JavaScript, Python, Java, .NET | Java, Python, C#, JavaScript, Ruby |
| Browsers | Its own builds of Chromium, Firefox and WebKit | The real Chrome, Firefox, Edge and Safari |
| Waiting | Built in | Explicit waits you write |
| Parallel runs | Workers and sharding built in | Through your test runner and Selenium Grid |
| Debugging | Trace viewer, video, screenshots | Screenshots and logs, video from Grid |
| Mobile | Device emulation | Real devices through Appium |
| Standard | Its own protocol | W3C WebDriver |
My short answer: for a new web project, I’d start with Playwright. For an existing Java or C# codebase with a Selenium suite, keep Selenium and fix the waits before thinking about a rewrite. A rewrite costs months and finds no new bugs.
Takeaway
The tool matters less than the habits. Good locators, no fixed sleeps and isolated tests make both tools stable.
Part 5: CI/CD, where tests decide what ships
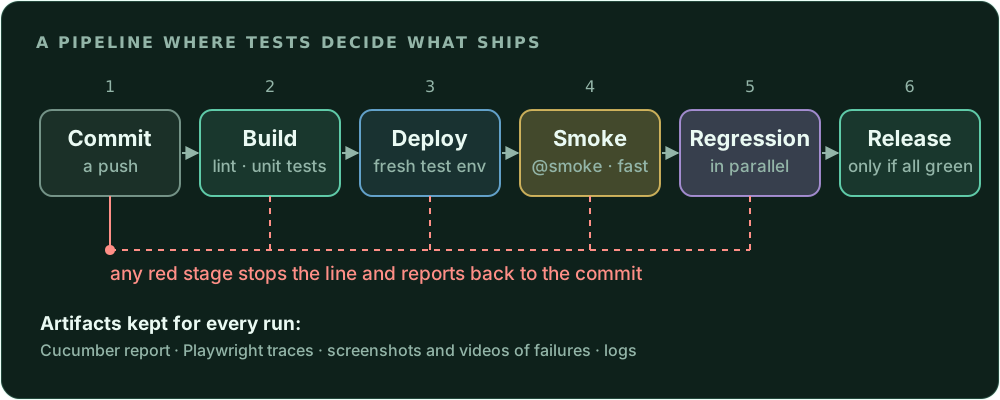
Tests on a laptop catch bugs for one person. Tests in the pipeline catch them for the whole team, on every change.
The stages
- Build: compile, lint and run unit tests. A few minutes at most.
- Deploy: put the build into a fresh test environment. Fresh matters: leftovers from yesterday’s run cause failures nobody can reproduce.
- Smoke: a small
@smokeset that checks the system is alive at all. If login is broken, there’s no point in running 800 more tests. - Regression: the full suite, split into shards that run in parallel.
- Release: only when everything is green.
An example with GitHub Actions
GitLab CI, Jenkins and Azure DevOps look different but follow the same shape. Here, smoke tests run first, then the regression suite runs as four parallel shards, then one job merges the reports:
name: system-tests
on: [pull_request]

env:
  BASE_URL: https://test.example.com   # the environment the deploy step created

jobs:
  smoke:
    runs-on: ubuntu-latest
    steps:
      - uses: actions/checkout@v4
      - uses: actions/setup-node@v4
        with: { node-version: 22 }
      - run: npm ci
      - run: npx playwright install --with-deps chromium
      - run: npx cucumber-js --tags @smoke
      - uses: actions/upload-artifact@v4
        if: ${{ !cancelled() }}
        with: { name: cucumber-report, path: reports/ }

  regression:
    needs: smoke
    runs-on: ubuntu-latest
    strategy:
      fail-fast: false
      matrix:
        shard: [1, 2, 3, 4]
    steps:
      - uses: actions/checkout@v4
      - uses: actions/setup-node@v4
        with: { node-version: 22 }
      - run: npm ci
      - run: npx playwright install --with-deps
      - run: npx playwright test --shard=${{ matrix.shard }}/4 --reporter=blob
      - uses: actions/upload-artifact@v4
        if: ${{ !cancelled() }}
        with:
          name: blob-report-${{ matrix.shard }}
          path: blob-report
          retention-days: 7

  report:
    needs: regression
    if: ${{ !cancelled() }}
    runs-on: ubuntu-latest
    steps:
      - uses: actions/checkout@v4
      - uses: actions/setup-node@v4
        with: { node-version: 22 }
      - run: npm ci
      - uses: actions/download-artifact@v4
        with:
          path: all-blob-reports
          pattern: blob-report-*
          merge-multiple: true
      - run: npx playwright merge-reports --reporter html ./all-blob-reports
      - uses: actions/upload-artifact@v4
        with: { name: playwright-report, path: playwright-report }
Some details that are easy to miss:
fail-fast: falselets every shard finish, so you see all failures in one run, not just the first.if: ${{ !cancelled() }}uploads the reports especially when tests fail. That’s when you need them.--reporter=blobwrites a raw report per shard, andmerge-reportsturns them into one HTML report.
Rules for a pipeline people trust
- Fast feedback. Developers should get a first answer within ten minutes. If they wait longer, they batch changes, and bigger batches hide more bugs.
- Red means stop. A failing test blocks the merge. If people can merge on red, the suite becomes decoration.
- Same versions everywhere. Pin the browser, the driver and the Node or JDK version. Run the tests in the same container image locally and on CI.
- Secrets stay in the CI system. Test passwords and API keys come from the pipeline’s secret store, never from the repository.
Part 6: Scaling out with Kubernetes
Why Kubernetes
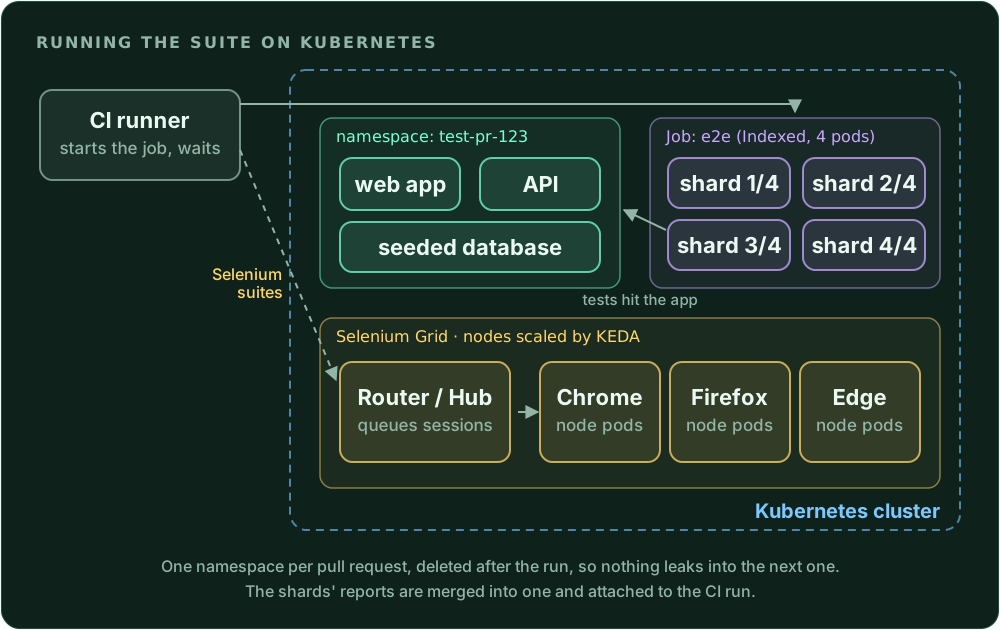
When a suite grows to hundreds of browser tests, one CI machine isn’t enough. Kubernetes helps in two ways:
- A fresh environment per pull request. Each pull request gets its own namespace with its own copy of the app and a seeded database. Tests never fight over shared data, and the namespace is deleted afterwards.
- Parallel test runners. Test shards run as pods, and browser nodes scale up and down with the number of waiting tests.
A test environment per pull request
The pipeline creates the namespace, installs the app with its Helm chart, runs the tests and cleans up:
NS=test-pr-$PR_NUMBER

kubectl create namespace $NS
helm upgrade --install app ./charts/app -n $NS --set image.tag=$GIT_SHA --wait
kubectl apply -n $NS -f e2e-job.yaml
# a failed shard makes this time out, so keep the timeout close to a normal run
kubectl wait -n $NS --for=condition=complete job/e2e --timeout=20m
kubectl delete namespace $NS
In a real pipeline the last line runs in an “always” step, so the namespace is removed even when the tests fail.
Playwright shards as an indexed Job
An indexed Job starts a fixed number of pods and gives each one its own number in JOB_COMPLETION_INDEX. That maps neatly onto Playwright’s --shard option:
apiVersion: batch/v1
kind: Job
metadata:
  name: e2e
spec:
  completionMode: Indexed
  completions: 4
  parallelism: 4
  backoffLimit: 0
  ttlSecondsAfterFinished: 3600
  template:
    spec:
      restartPolicy: Never
      containers:
        - name: tests
          # your tests, built FROM mcr.microsoft.com/playwright (same version as in package.json)
          image: registry.example.com/e2e-tests:1.4.0
          command: ["sh", "-c"]
          args:
            - npx playwright test --shard=$((JOB_COMPLETION_INDEX + 1))/4 --reporter=blob
          env:
            - name: BASE_URL
              value: http://web          # the app's service in the same namespace
          resources:
            requests: { cpu: "1", memory: 2Gi }
            limits: { memory: 3Gi }
          volumeMounts:
            - { name: dshm, mountPath: /dev/shm }
      volumes:
        - name: dshm
          emptyDir: { medium: Memory, sizeLimit: 1Gi }
Two details from experience with browsers in containers:
- Give Chromium shared memory. The default
/dev/shmin a container is tiny, and Chromium crashes with odd errors when it runs out. The memory-backed volume above fixes that. - Set memory requests honestly. A browser easily needs 1 to 2 GB. If the requests are too low, Kubernetes packs too many pods on one node and tests time out for no visible reason.
At the end of each pod, copy the blob-report folder to shared storage (a bucket or a volume), so the pipeline can merge the shards into one report.
Selenium Grid on Kubernetes
For Selenium suites, the Selenium project publishes a Helm chart for Grid:
helm repo add docker-selenium https://www.selenium.dev/docker-selenium
helm install selenium-grid docker-selenium/selenium-grid -n selenium --create-namespace
The router takes new sessions and queues them, and browser nodes run as pods. The chart can also set up KEDA, which adds browser pods when sessions are waiting in the queue and removes them when the queue is empty. You pay for browsers only while tests run. The tests then point SELENIUM_GRID_URL at the Grid’s service.
Takeaway
Kubernetes doesn’t make tests better. It makes good tests fast and isolated. Fix flaky tests before you scale them, or you’ll just get flaky results faster.
Part 7: System tests beyond the browser
Not every system has a web page. At Vector I wrote test automation in C# on CANoe and CANape to validate hardware-near CAN drivers, and the same ideas apply there.
Gherkin works just as well for an embedded system:
@hil
Feature: Speed sensor on the CAN bus

  Scenario: The sensor sends its status every 10 ms
    Given the sensor is powered and has no stored errors
    When I record the bus for 1 second
    Then frame 0x200 arrives every 10 ms ± 1 ms
The step behind the last line uses Reqnroll and a thin ICanBus interface. In the lab it’s backed by the CANoe .NET API, on CI by a simulated bus:
[Binding]
public class SensorSteps(ICanBus bus)
{
    private IReadOnlyList<CanFrame> frames = [];

    [When("I record the bus for {int} second")]
    public async Task Record(int seconds) =>
        frames = await bus.Record(TimeSpan.FromSeconds(seconds));

    [Then(@"^frame 0x([0-9A-F]+) arrives every (\d+) ms ± (\d+) ms$")]
    public void ArrivesEvery(string idHex, int periodMs, int toleranceMs)
    {
        var id = Convert.ToUInt32(idHex, 16);
        var times = frames.Where(f => f.Id == id).Select(f => f.Timestamp).ToList();
        var gaps = times.Zip(times.Skip(1), (a, b) => (b - a).TotalMilliseconds);
        Assert.All(gaps, g => Assert.InRange(g, periodMs - toleranceMs, periodMs + toleranceMs));
    }
}
The IDs and numbers are made up, the pattern isn’t. Three things change near hardware:
- Tolerances, not exact values. Timestamps jitter and sensors drift. The tolerance comes from the specification, not from “whatever passed yesterday”.
- Reset before every test. Power-cycle the device and check the preconditions first. “Bench not ready” and “driver broken” are different bugs.
- Keep the bus trace. Save the log of every failed run as an artifact. Nobody can debug a timing problem from a red line in a report.
Part 8: Flaky tests
A flaky test passes and fails on the same code. Every flake teaches the team to ignore red builds. Automatic retries hide the problem; finding the cause fixes it.
| Cause | How it shows | Fix |
|---|---|---|
| Fixed sleeps | Fails on a slow or busy runner | Wait for a condition, not for time |
| Shared test data | Passes alone, fails in the full run | Fresh data per test |
| Test order | Fails when run in parallel | Every test sets up what it needs |
| Animations | Clicks land on the wrong element | reducedMotion: 'reduce', wait for stable elements |
| Dates and time zones | Fails at midnight or month end | Set the clock in the test |
| Outside services | Fails when a third party is slow | Mock it in most tests, check the real one separately |
| Lab state | Fails after another test left the device in an error state | Reset in setup, check preconditions |
When a test flakes, I move it to quarantine with a ticket and an owner. A skipped test with no owner is a deleted test that nobody admits to deleting.
A checklist to take with you
Writing scenarios
- One behaviour per scenario, three to seven steps
- Declarative steps in the words of the business
- Tags for
@smoke, devices and environments
Writing automation
- Locators by role and text
- No fixed sleeps, web-first assertions
- A fresh browser context and fresh data for every test
- Test data through the API, checks through the UI
- Screenshot, trace or bus log attached on every failure
Running it
- Smoke first, full regression in parallel shards
- A fresh environment for every run
- Pinned versions, the same image locally and on CI
- Red blocks the merge
- Flaky tests quarantined with an owner
The short version
Good automated system tests read like the specification and run like a machine. Cucumber keeps them readable for the whole team. Playwright or Selenium drives the browser without guessing about timing. A CI/CD pipeline runs them on every change, and Kubernetes gives each run its own clean environment and enough browsers to finish quickly.
The rule behind all of it
Write tests for the person who has to fix the bug. Often that’s you, six months later.